


Financial Valuation is both art and science. The science part is the historical data provided by annual reports and art is to estimate of what future holds.
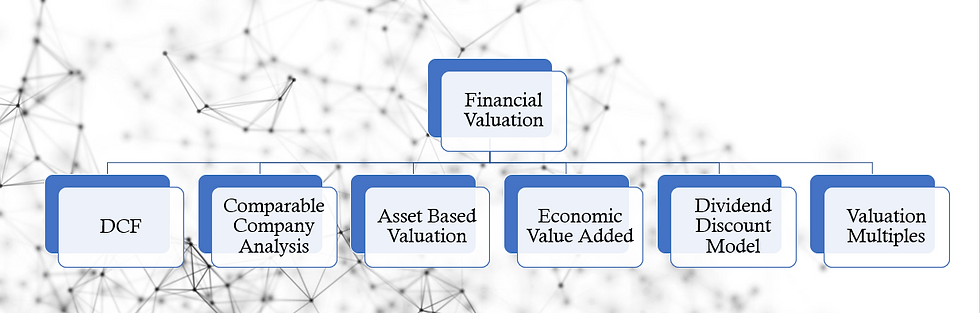
There are many different financial valuation methods that businesses and investors use to determine the value of a company or asset. Here are five commonly used methods:
A. Discounted Cash Flow (DCF) Analysis: This method involves estimating the future cash flows of a company and then discounting those cash flows back to their present value using a discount rate. The present value of the cash flows is the estimated value of the company.
Discounted Cash Flow (DCF) analysis is a method of valuing a company based on the present value of its expected future cash flows. The basic idea behind DCF analysis is that the value of a business is equal to the sum of the present values of all future cash flows expected to be generated by the business.
To conduct a DCF analysis, an analyst must first estimate the future cash flows a company is expected to generate. These cash flows are then discounted back to their present value using a discount rate that reflects the time value of money and the risk associated with the investment.
The discount rate used in the DCF analysis can be the company's weighted average cost of capital (WACC), which takes into account the cost of debt and equity financing.
Alternatively, an analyst may use a higher discount rate to account for the additional risk associated with the investment. The result of the DCF analysis is the estimated intrinsic value of the company, which can be compared to its current market value to determine whether the company is overvalued or undervalued. DCF analysis is widely used in corporate finance and investment banking to evaluate the potential value of an investment or acquisition.
B. Comparable Company Analysis (CCA): This method involves comparing a company to other similar companies in the same industry to determine its valuation. This is typically done by looking at metrics such as P/E ratios, revenue growth, and profit margins.
Comparable Company Analysis (CCA) is a financial valuation method that compares a company's financial metrics, such as revenue, earnings, or EBITDA, to those of similar companies in the same industry or sector. This method is also known as a "comps analysis" or "peer group analysis."
The goal of CCA is to determine the relative valuation of a company by comparing its financial performance to that of similar companies. This allows analysts and investors to assess the company's strengths and weaknesses and identify potential areas for improvement.
To conduct a CCA, an analyst typically selects a group of similar companies and compares their financial metrics to those of the company being analyzed. These metrics may include revenue, earnings, profit margins, price-to-earnings ratio (P/E), or price-to-book ratio (P/B).
Once the financial metrics of the comparable companies have been collected, the analyst calculates the average or median values for each metric and compares them to the corresponding values for the company being analyzed. If the company being analyzed has higher or lower financial metrics than the comparable companies, it may indicate that the company is overvalued or undervalued relative to its peers.
CCA is widely used in investment banking, corporate finance, and equity research to determine the fair value of a company. It's important to note that CCA should not be the only method used to value a company, and analysts should also consider other factors such as the company's growth prospects, industry trends, and macroeconomic conditions.
C. Asset-Based Valuation: This method involves valuing a company based on the value of its assets, including tangible assets such as property, plant, and equipment, as well as intangible assets such as intellectual property and brand equity.
Asset-Based Valuation (ABV) is a method of determining the value of a company based on its assets and liabilities. This method is particularly useful for companies that have tangible assets, such as manufacturing companies, real estate firms, and mining companies.
To conduct an ABV, an analyst begins by determining the value of the company's assets, which may include its land, buildings, equipment, inventory, and investments. The analyst then subtracts the value of the company's liabilities, such as debt, accounts payable, and other obligations. The resulting value is the company's net asset value (NAV).
There are two main types of ABV: the going concern asset-based approach and the liquidation asset-based approach. The going concern asset-based approach assumes that the company will continue to operate as a going concern, and therefore, the value of the assets is based on their current market value. The liquidation asset-based approach assumes that the company will be liquidated, and the value of the assets is based on their liquidation value, which is typically lower than their market value.
ABV can be used to determine the minimum value of a company in the event of a liquidation or bankruptcy. However, it may not be the most appropriate valuation method for companies that have significant intangible assets, such as intellectual property, brand recognition, or customer relationships.
In summary, ABV is a useful method for valuing companies with tangible assets, and it can provide a conservative estimate of a company's value. However, it should be used in conjunction with other valuation methods and should be tailored to the specific circumstances of the company being analyzed.
D. Economic Value Added (EVA) Analysis: This method involves calculating a company's net operating profit after tax (NOPAT) and subtracting the cost of capital to determine the company's economic value added. EVA is a measure of the company's profitability and can be used to assess its overall value.
E. Dividend Discount Model (DDM): This method values a company's stock based on the present value of its expected future dividends
The Dividend Discount Model (DDM) is a financial valuation method that calculates the present value of future dividends paid by a company. This model is based on the assumption that the value of a stock is equal to the sum of its future dividends, discounted back to their present value.
To use the DDM, an analyst first estimates the future dividends that a company is expected to pay. This estimation can be based on the company's historical dividend payments, projected future earnings, or other factors. The analyst then applies a discount rate to the future dividends to account for the time value of money and the risk associated with the investment.
The discount rate used in the DDM typically reflects the company's cost of equity, which is the expected rate of return that investors require to invest in the company's stock. This rate can be estimated using various methods, including the Capital Asset Pricing Model (CAPM) or the Dividend Growth Model.
Once the future dividends and discount rate have been estimated, the analyst can calculate the present value of the expected dividends using the following formula:
V = D / (1 + r) + D / (1 + r) ^ 2 + ... + D / (1 + r) ^ n
where PV is the present value of the expected dividends, D is the expected dividend payment, r is the discount rate, and n is the number of periods in the future.
The result of the DDM calculation is the intrinsic value of the stock, which can be compared to the current market price to determine whether the stock is undervalued or overvalued.
It's important to note that the DDM is based on several assumptions, including the stability and predictability of future dividends, the discount rate used, and the accuracy of the earnings projections. Therefore, it should be used in conjunction with other valuation methods and should be tailored to the specific circumstances of the company being analyzed.
F. Valuation multiples are ratios that are used to compare the value of a company to a relevant financial metric, such as earnings, revenue, or book value. These ratios are calculated by dividing the market value of the company by the financial metric being used. Valuation multiples can be useful in comparing companies within the same industry or sector and can help investors identify undervalued or overvalued stocks.

Common valuation multiples include:
1. Price-to-Earnings (P/E) Ratio: This is the ratio of a company's current share price to its earnings per share (EPS) over the past 12 months. A higher P/E ratio indicates that investors are willing to pay more for each dollar of earnings, which may reflect higher growth prospects or a higher risk profile.
2. Price-to-Book (P/B) Ratio: This is the ratio of a company's current share price to its book value per share, which is the company's assets minus its liabilities. A lower P/B ratio may indicate that the company is undervalued relative to its assets.
3. Enterprise Value-to-Revenue (EV/R): This is the ratio of a company's enterprise value (which includes its market capitalization, debt, and preferred stock minus its cash and cash equivalents) to its revenue over the past 12 months. A lower EV/R ratio may indicate that the company is undervalued relative to its revenue.
4. Enterprise Value-to-EBITDA (EV/EBITDA): This is the ratio of a company's enterprise value to its earnings before interest, taxes, depreciation, and amortization (EBITDA) over the past 12 months. This ratio is often used in industries with high levels of capital expenditure, such as manufacturing or energy, and a lower ratio may indicate that the company is undervalued relative to its EBITDA.
Valuation multiples can provide a quick and easy way to compare the relative value of companies within an industry or sector.
However, it's important to note that these ratios are based on historical financial metrics and may not reflect future growth prospects or changes in the industry or macroeconomic conditions. Therefore, valuation multiples should be used in conjunction with other valuation methods and should be tailored to the specific circumstances of the company being analyzed.
Σχόλια